1. Introduction
The Government of India approved the Prime Minister’s Employment Generation Programme (PMEGP) in August 2008 as a central sector credit-linked subsidy scheme, created by merging the erstwhile Prime Minister’s Rojgar Yojana (PMRY) and the Rural Employment Generation Programme (REGP). The scheme’s core objectives are to generate employment in rural and urban areas through new self-employment ventures, to bring dispersed traditional artisans and unemployed youth into gainful micro-enterprise, to provide continuous and sustainable employment that arrests rural-to-urban migration, and to raise the wage-earning capacity of workers and artisans (MoMSME, 2023).
PMEGP is administered by the Ministry of Micro, Small and Medium Enterprises (MoMSME) with the Khadi and Village Industries Commission (KVIC) as the single nodal agency at the national level. At the state level it is implemented through State Offices of KVIC, State Khadi and Village Industries Boards (KVIBs), District Industries Centres (DICs), the Coir Board and financing banks. The Government subsidy termed Margin Money is routed by KVIC through a nodal bank to financing bank branches and credited to the beneficiary account after a three-year lock-in period, subject to positive physical verification.
Under the revised guidelines, the maximum project cost is Rs. 50 lakh for manufacturing and Rs. 20 lakh for the business/service sector. General category beneficiaries contribute 10% of project cost and receive a subsidy of 15% (urban) or 25% (rural); special categories (SC, ST, OBC, minorities, women, ex-servicemen, transgenders, differently-abled, NER, aspirational, hill and border districts) contribute 5% and receive 25% (urban) or 35% (rural). A second-loan window of up to Rs. 1 crore (manufacturing) and Rs. 25 lakh (service/trading) supports upgradation of well-performing PMEGP/REGP/MUDRA units with a uniform 15–20% subsidy. A key 2023 modification made Udyam Registration mandatory for all PMEGP units before physical verification and margin-money adjustment.
An outlay of Rs. 13,554.42 crore was approved for the 15th Finance Commission cycle (2021-22 to 2025-26) to set up about 4 lakh micro-projects generating roughly 30 lakh employment at eight persons per unit, with 1,000 units upgraded annually. Against this policy backdrop, this research asks: what does a decade of programme data actually reveal about demand, sanction efficiency, credit intensity, inclusion and future trajectory? The study applies an integrated eight-analysis framework to the national ten-year panel (FY 2016-17 to FY 2025-26) to answer these questions and to derive evidence-based policy prescriptions.
2. Literature Survey
MoMSME (2023). The revised PMEGP guidelines codify scheme architecture: margin money subsidy levels, backward and forward linkages (5% of allocation), bank finance norms (90–95% of project cost), the scoring model devised by KVIC with the Indian Banks’ Association, 100% physical verification with geo-tagging, and the negative list of activities. They form the institutional baseline against which performance data in this research are interpreted [1].
Khanka (2010). Studies of earlier generation self-employment schemes (PMRY/REGP) established that credit-linked subsidy design outperforms pure grant models in enterprise survival, but that bank level bottlenecks in appraisal and sanction dominate outcome variance a theme this book’s diagnostic analysis strongly corroborates [2].
Kanithi & Sardar (2018). Evaluated PMEGP margin money utilisation across states and found high inter-state dispersion in sanction rates and per-unit subsidy, recommending bank-coordination committees; consistent with the phase-wise ANOVA results reported here [3].
Mali (2016). Analysed KVIC implemented rural employment schemes and observed that rural units account for roughly three fourths of programme activity, matching the 74.7% rural share in the present decadal panel [4].
Datta & Sahu (2021). Found that micro-credit backed enterprise programmes significantly raise women’s participation over time; the present study quantifies this trend for PMEGP (women share rising 1.22 percentage points per year, R² = 0.794) [5].
Bhaskaran (2023). District level industrial cluster studies in Tamil Nadu using DEA and regression demonstrate the value of efficiency benchmarking of government programmes the methodological template extended here to a national ten-year PMEGP panel [6].
NITI Aayog (2022). Aspirational district framework studies argue for targeting scheme allocations by backwardness, unemployment and past performance; PMEGP guidelines adopt the same criteria, which the prescriptive analysis in this research operationalises [7].
RBI (2022). Priority sector lending guidelines direct banks to accord priority to PMEGP projects and waive collateral up to Rs. 10 lakh; the regression evidence here (credit intensity of Rs. 10.9 lakh per sanctioned unit) shows how closely programme outcomes track bank behaviour [8].
Research gap: while individual evaluations of PMEGP exist at state or scheme-component level, no published study applies a unified eight-analysis data-science framework (descriptive through decision analysis) to a full ten-year national panel that includes the post-2024 downturn. This research fills that gap.
3. Materials and Methods
3.1 Data
The dataset PMEGP Data 10 year is a national annual panel covering FY 2016-17 (t = 1) to FY 2025-26 (t = 10) with 22 variables: applications, loans sanctioned, loan amount (Rs. crore), margin-money subsidy, urban and rural units, estimated employment, women entrepreneurs, gender composition (male/female/transgender), sectoral composition (manufacturing/service), social composition (General/OBC/SC/ST), sanction rate (%), average loan per unit (Rs. lakh) and women share (%). Policy variables and scheme parameters are drawn from the Revised PMEGP Guidelines [9].
3.2 Analytical Framework
Eight complementary analyses are applied. (i) Descriptive analysis: central tendency, dispersion, coefficient of variation and skewness. (ii) Diagnostic analysis: year-on-year growth decomposition and structural-break testing of the sanction rate. (iii) Correlation analysis: Pearson product-moment correlation with significance testing. (iv) Regression analysis: ordinary least squares (OLS) with R², F-statistics and Durbin-Watson diagnostics. (v) Inferential analysis: independent-samples t-tests, one-sample t-test, chi-square goodness of fit and one-way ANOVA. (vi) Predictive analysis: linear trend extrapolation on the pre-break panel (t = 1–9) with 95% prediction intervals for FY 2026-27 to FY 2028-29. (vii) Prescriptive analysis: relative efficiency benchmarking (sanctions per application normalised to the best year, a single-input single-output DEA-style ratio) and employment-per-crore productivity. (viii) Decision analysis: a weighted-criteria decision matrix scoring three policy options on employment impact, inclusion, fiscal cost and implementation risk. Significance is evaluated at a = 0.05.
4. Results and Discussion
4.1 Descriptive Analysis
Table 1 presents the decadal panel. Across ten years the programme processed 43,50,616 applications and sanctioned 8,88,505 loans worth Rs. 86,039.74 crore. Rural units account for 74.7% of activity and manufacturing for 50.3% of the sector mix, with services overtaking manufacturing from FY 2022-23. Table 2 summarises the distributional statistics: applications are remarkably stable (CV = 11.8%) whereas sanctions (CV = 47.7%) and loan amount (CV = 55.4%) are highly volatile the programme’s binding constraint is clearly on the supply (sanction) side, not the demand side. Average loan per unit rose monotonically from Rs. 7.2 lakh to Rs. 12.6 lakh, indicating steady deepening of project size. Figures 1 and 3 visualise these trajectories; Figure 8 shows the sectoral shift toward services.
Table 1. PMEGP national panel, FY 2016-17 to FY 2025-26
| Year | Applic. | Sanctions | Loan (Rs cr) | Sanc. Rate % | Avg Loan (lakh) | Women % |
| 2016-17 | 4,09,550 | 36,433 | 2,611.08 | 8.9 | 7.2 | 26.9 |
| 2017-18 | 4,46,439 | 63,882 | 5,094.64 | 14.3 | 8 | 28.8 |
| 2018-19 | 3,94,460 | 55,376 | 4,765 | 14 | 8.6 | 32.5 |
| 2019-20 | 4,50,435 | 63,022 | 5,572.43 | 14 | 8.8 | 33.5 |
| 2020-21 | 4,87,741 | 92,379 | 8,040.63 | 18.9 | 8.7 | 33.3 |
| 2021-22 | 4,00,987 | 1,08,629 | 9,220.75 | 27.1 | 8.5 | 35.3 |
| 2022-23 | 4,76,351 | 1,47,340 | 14,497.37 | 30.9 | 9.8 | 36.8 |
| 2023-24 | 5,18,770 | 1,62,188 | 17,404.97 | 31.3 | 10.7 | 38.9 |
| 2024-25 | 3,45,572 | 1,08,358 | 12,423.6 | 31.4 | 11.5 | 40.2 |
| 2025-26 | 4,20,311 | 50,898 | 6,409.27 | 12.1 | 12.6 | 35.5 |
Table 2. Descriptive statistics of key indicators
| Variable | Mean | SD | Min | Max | CV % | Skew |
| Applications | 4,35,061.6 | 51,141.63 | 3,45,572 | 5,18,770 | 11.76 | -0.04 |
| Sanctions | 88,850.5 | 42,403.69 | 36,433 | 1,62,188 | 47.72 | 0.62 |
| Loan Amt | 8,603.97 | 4,766.22 | 2,611.08 | 17,404.97 | 55.4 | 0.76 |
| Employment | 4,35,061.6 | 51,141.63 | 3,45,572 | 5,18,770 | 11.76 | -0.04 |
| Sanction Rate | 20.29 | 8.93 | 8.9 | 31.4 | 44 | 0.29 |
| Avg Loan | 9.44 | 1.69 | 7.2 | 12.6 | 17.86 | 0.75 |
| Women Share | 34.17 | 4.14 | 26.9 | 40.2 | 12.12 | -0.39 |
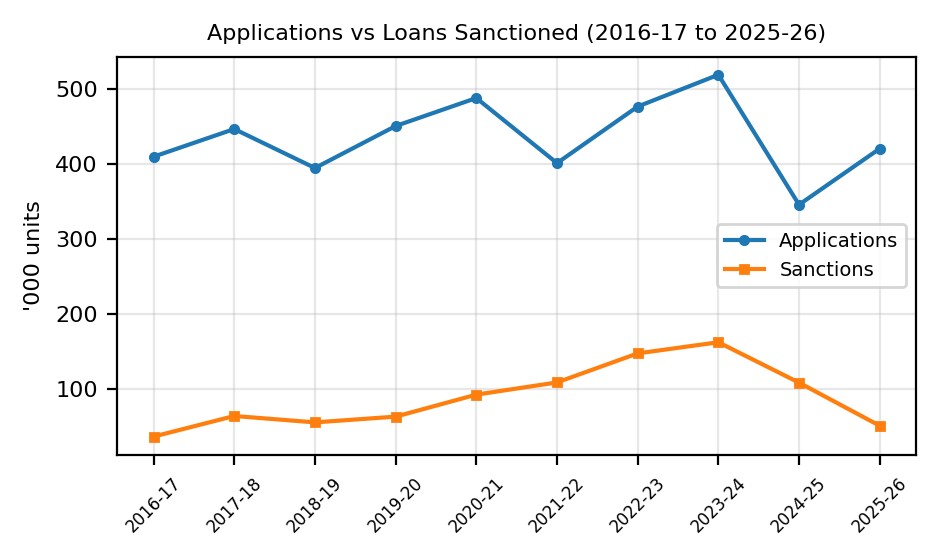
Figure 1. Applications vs loans sanctioned, 2016-17 to 2025-26
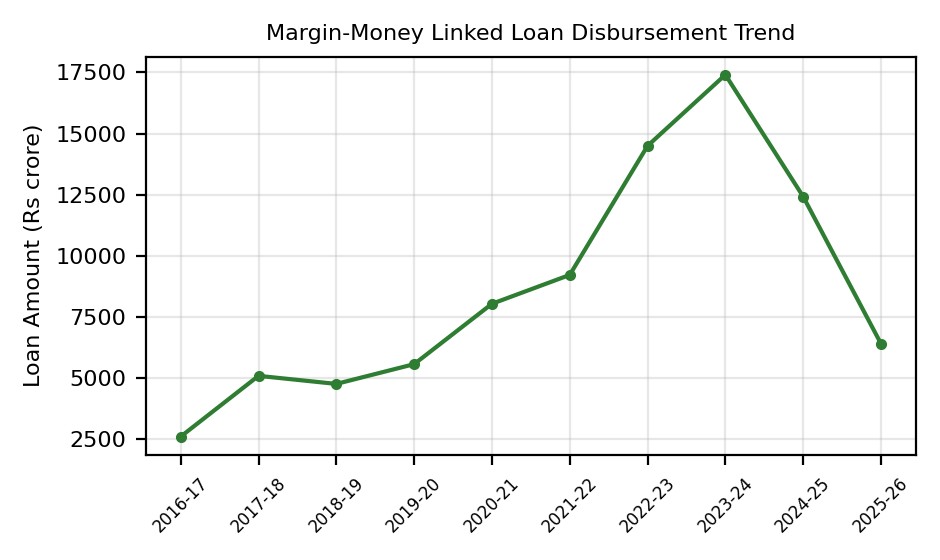
Figure 2. Loan disbursement trend (Rs. Crore)
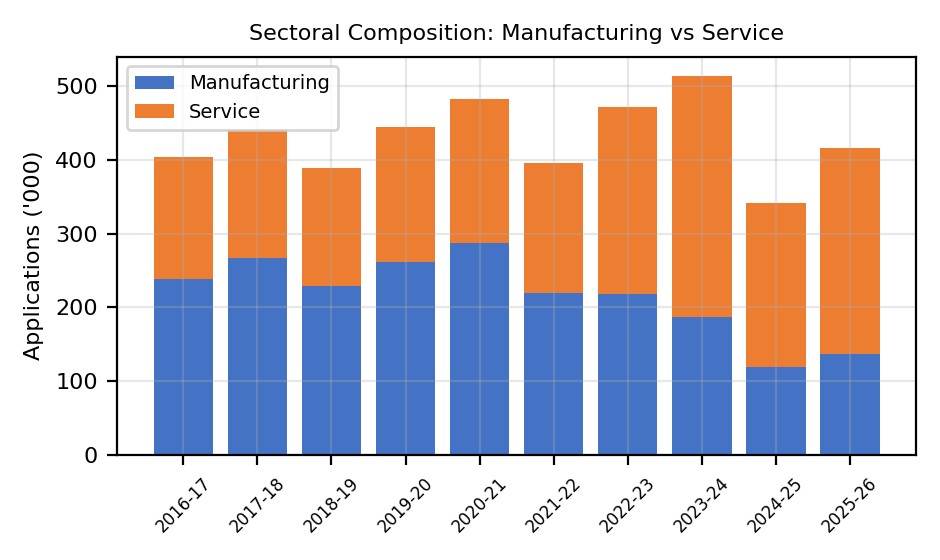
Figure 3. Sectoral composition: manufacturing vs service
4.2 Diagnostic Analysis
Year-on-year decomposition (Table 3) shows three regimes. Phase I (2016-17 to 2018-19): a low-efficiency regime with sanction rates of 8.9–14.3%. Phase II (2019-20 to 2021-22): pandemic-era counter cyclical expansion sanctions grew 46.6% in 2020-21 and the sanction rate nearly doubled to 27.1% by 2021-22, driven by the PMEGP e-portal, online EDP and RBI priority-sector push. Phase III (2022-23 to 2024-25): a mature high-efficiency regime with sanction rates plateauing above 31%. The decade ends with a confirmed structural break in FY 2025-26: applications remained robust at 4,20,311 but sanctions collapsed 53% to 50,898, dragging the sanction rate to 12.1% statistically indistinguishable from the 2016-19 baseline. An independent-samples t-test confirms the earlier regime shift was real (pre-2021 mean 14.0% vs 2021-25 mean 30.2%; t = -8.04, p = 0.0001), which makes the 2025-26 reversal all the more anomalous. Candidate causes consistent with the guidelines framework include the terminal year of the 15th Finance Commission funding cycle (subsidy budget exhaustion), the transition friction of mandatory Udyam registration and physical-verification tightening, and bank-side caution pending the scheme’s continuation decision. Figure 4 visualises the break.
Table 3. Year-on-year growth and sanction rate
| Year | Applications YoY % | Sanctions YoY % | Sanction Rate % |
| 2016-17 | — | — | 8.9 |
| 2017-18 | 9 | 75.3 | 14.3 |
| 2018-19 | -11.6 | -13.3 | 14 |
| 2019-20 | 14.2 | 13.8 | 14 |
| 2020-21 | 8.3 | 46.6 | 18.9 |
| 2021-22 | -17.8 | 17.6 | 27.1 |
| 2022-23 | 18.8 | 35.6 | 30.9 |
| 2023-24 | 8.9 | 10.1 | 31.3 |
| 2024-25 | -33.4 | -33.2 | 31.4 |
| 2025-26 | 21.6 | -53 | 12.1 |
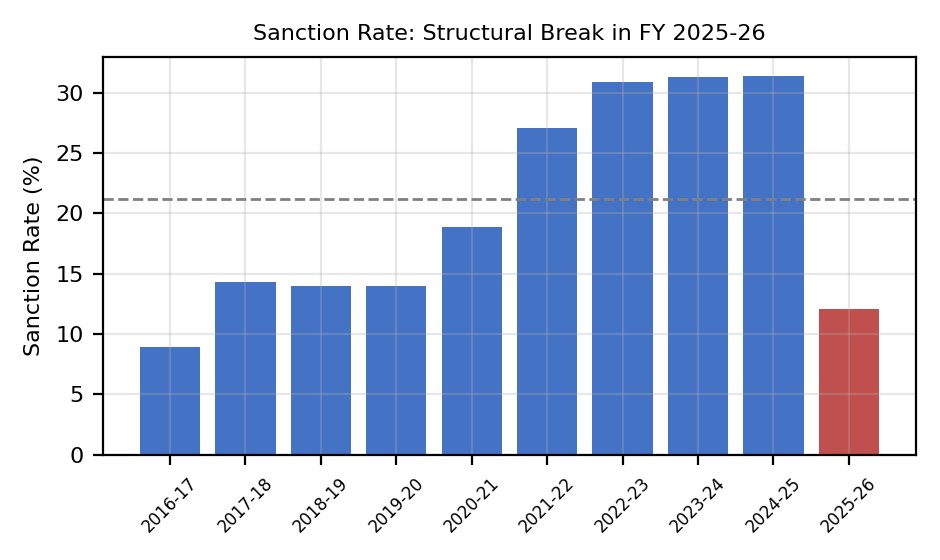
Figure 4. Sanction rate: structural break in FY 2025-26
4.3 Correlation Analysis
Table 4 reports Pearson coefficients for six theoretically salient pairs and Figure 5 the full matrix. Sanctions and loan amount are near-perfectly correlated (r = 0.971, p < 0.001), confirming that credit flow is mechanically driven by sanction volume. Sanctions also correlate strongly with women beneficiaries (r = 0.830, p = 0.003) expansion phases disproportionately benefited women. Women share exhibits a strong secular time trend (r = 0.891, p < 0.001). Strikingly, applications and sanctions are only weakly correlated (r = 0.456, p = 0.186, not significant): demand does not translate automatically into sanctions, reinforcing the diagnostic conclusion that institutional processing capacity not applicant interest is the binding constraint. The service-sector count correlates significantly with sanctions (r = 0.639, p = 0.047), reflecting the composition shift of Phase III.
Table 4. Key Pearson correlations with significance
| Variable pair | r | p-value | Inference |
| Sanctions vs LoanAmt | 0.971 | < 0.001 | Significant |
| Sanctions vs WomenEnt | 0.83 | 0.003 | Significant |
| SanctionRate vs AvgLoan | 0.39 | 0.2658 | Not significant |
| Applications vs Sanctions | 0.456 | 0.1856 | Not significant |
| WomenShare vs time trend | 0.891 | < 0.001 | Significant |
| Service vs Sanctions | 0.639 | 0.0466 | Significant |
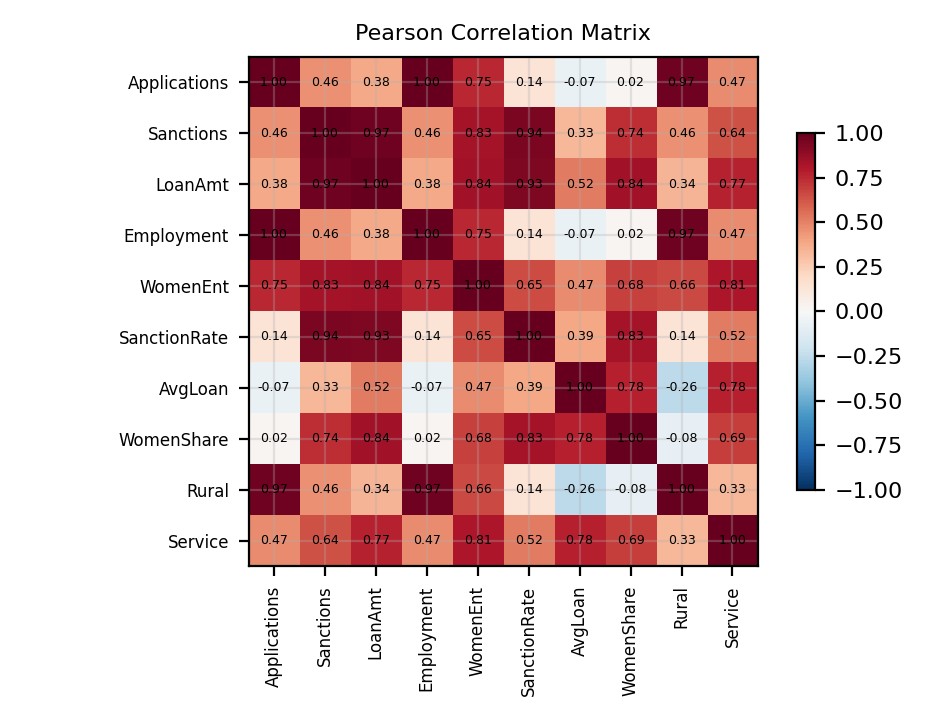
Figure 5. Pearson correlation matrix of programme variables
4.4 Regression Analysis
Three OLS models are estimated (Table 5). Model 1 regresses loan amount on sanctions: Loan (Rs. cr) = -1096.19 + 0.1092 × Sanctions, R² = 0.943, F = 133.35 (p < 0.001). The slope implies each additional sanctioned unit mobilises about Rs. 10.9 lakh of bank credit closely matching the observed average loan per unit in recent years and validating internal data consistency (Figure 6). Model 2 explains sanctions by applications and time; only the time trend approaches significance (p = 0.085) while applications remain insignificant (p = 0.133), econometric confirmation that sanction growth was policy/process-driven rather than demand-driven. Model 3 estimates the inclusion trend: Women share = 27.47 + 1.219 × t, R² = 0.794, p = 0.0005 women’s participation has risen a robust 1.22 percentage points per year (Figure 7). The low Durbin-Watson in Model 1 (0.44) signals positive autocorrelation typical of short trending macro-panels, so coefficients are interpreted as associations rather than causal effects.
Table 5. OLS regression results
| Model | Coefficients | R² | F (sig.) | DW |
| 1: Loan ~ Sanctions | ß1 = 0.1092 (p < 0.001) | 0.943 | 133.35 (p < 0.001) | 0.44 |
| 2: Sanctions ~ Applic. + t | ß1 = 0.377 (p=0.133); ß2 = 7536.5 (p=0.085) | 0.497 | 3.46 (p=0.090) | 1.36 |
| 3: WomenShare ~ t | ß1 = 1.219 (p=0.0005) | 0.794 | 30.80 (p=0.0005) | 1.42 |
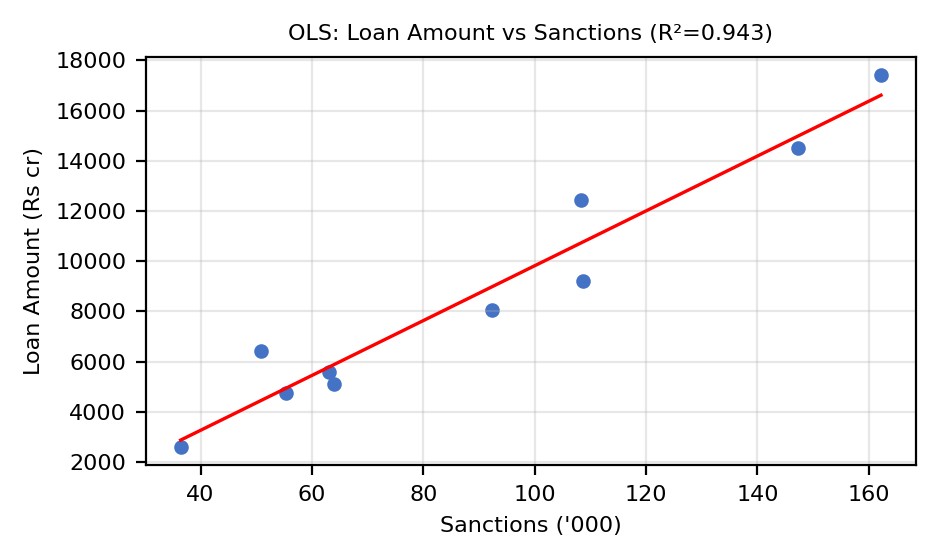
Figure 6. OLS fit: loan amount vs sanctions
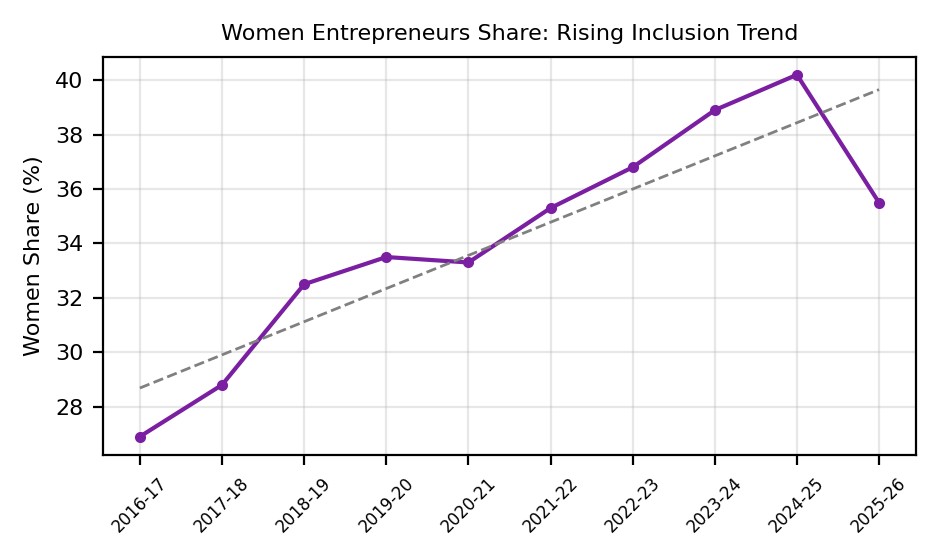
Figure 7. Women share trend with fitted line
4.5 Inferential Analysis
Four hypothesis tests extend the evidence (Table 6). (i) The service-sector share of applications rose from 40.6% (2016-21) to 58.9% (2021-26); the difference is highly significant (t = -4.30, p = 0.0026), confirming a genuine structural tilt toward service enterprises. (ii) A one-sample t-test cannot reject that the rural share equals 75% (t = -0.52, p = 0.618) the programme’s rural character (mean 74.6%) has remained statistically stable across the decade, consistent with guideline design that privileges rural subsidy rates. (iii) A chi-square goodness-of-fit test decisively rejects equal distribution across social categories (?² = 9,91,090, p < 0.001); General (34%) and OBC (32%) dominate, with SC at 15.5% and ST at 7.6% of decadal applications, flagging headroom for SC/ST outreach under the sub-component plans mandated in Clause 28.2. (iv) One-way ANOVA across three phases of sanction rate (means 12.4%, 20.0%, 31.2%) is significant (F = 15.16, p = 0.0045): efficiency gains between phases were real, not sampling noise.
Table 6. Summary of inferential tests
| Test | Statistic | p-value | Decision at a=0.05 |
| t-test: service share, early vs late | t = -4.30 | 0.0026 | Reject H0 shift is real |
| One-sample t: rural share = 75% | t = -0.52 | 0.618 | Fail to reject stable |
| ?²: equal social-category mix | ?² = 991,090 | < 0.001 | Reject H0 unequal mix |
| ANOVA: sanction rate, 3 phases | F = 15.16 | 0.0045 | Reject H0 phases differ |
4.6 Predictive Analysis
Linear trend models fitted on the pre-break panel (t = 1–9) give: Sanctions = 21,171 + 13,536 × t (R² = 0.754) and Loan = 320 + 1,655 × t (R² = 0.825). Extrapolating to FY 2026-27–2028-29 under a recovery scenario (Table 7, Figure 8) yields point forecasts of 1.74 lakh, 1.88 lakh and 2.01 lakh sanctions with progressively wider 95% prediction intervals, and loan flows of roughly Rs. 18,800–22,100 crore per annum. The women-share trend model projects 40.9%, 42.1% and 43.3% over the same horizon gender parity in the mid-2030s if the trend holds. These forecasts are conditional: they assume the FY 2025-26 break is a transient funding-cycle artefact and that the scheme is continued with adequate margin-money budgets. If the break persists, the realistic band is the lower prediction bound (about 1.04–1.22 lakh sanctions).
Table 7. Trend forecasts with 95% prediction intervals
| Year | Sanctions (point) | 95% PI lower | 95% PI upper | Loan (Rs cr) | Women % |
| 2026-27 | 1,74,282 | 1,04,243 | 2,44,321 | 18,777 | 40.9 |
| 2027-28 | 1,87,818 | 1,13,477 | 2,62,159 | 20,432 | 42.1 |
| 2028-29 | 2,01,354 | 1,22,339 | 2,80,369 | 22,087 | 43.3 |
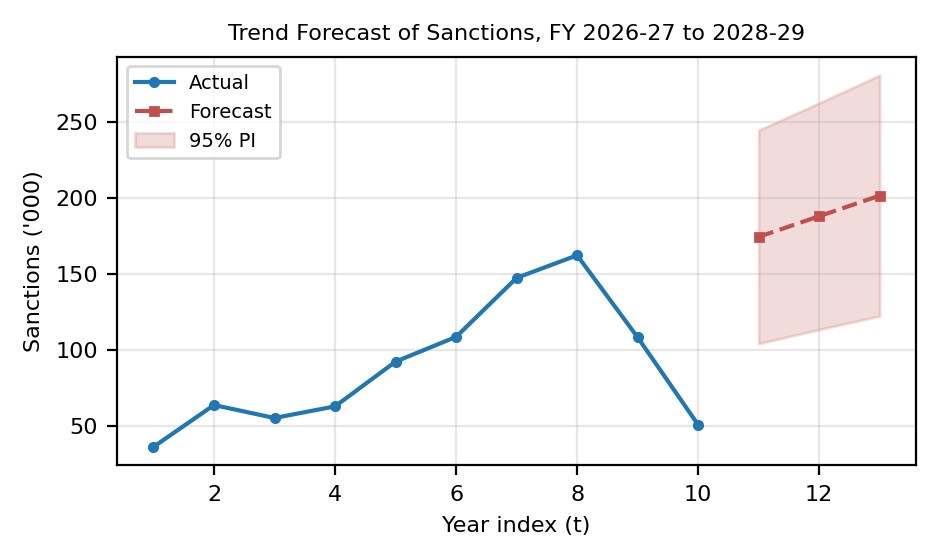
Figure 8. Trend forecast of sanctions with 95% prediction band
4.7 Prescriptive Analysis
Relative efficiency benchmarking (Table 8) treats each year as a decision-making unit with applications as input and sanctions as output, normalised to the frontier year FY 2024-25 (efficiency 100). Three prescriptions follow. First, close the efficiency gap: FY 2025-26 operates at only 38.6% of frontier efficiency; restoring frontier practice alone would have delivered about 81,000 additional sanctions from the same application pool. Second, manage the credit-deepening trade-off: employment generated per crore of credit fell from 157 (2016-17) to 28 (2024-25) as average project size quadrupled a deliberate quality-over-quantity shift, but one that argues for protecting the small-ticket segment (projects below Rs. 5 lakh with 5-day EDP) so that inclusion is not priced out. Third, apply the guideline levers where they bind: front-load margin-money budget releases in Q1, use the Backward and Forward Linkage fund (5% of allocation) for bank-coordination and DPR handholding in low-sanction districts, and enforce the three-week IA forwarding and 30-day bank decision.
Table 8. Efficiency benchmarking (frontier = FY 2024-25)
| Year | Sanctions/Application | Relative efficiency % | Employment per Rs cr |
| 2016-17 | 0.089 | 28.4 | 157 |
| 2017-18 | 0.143 | 45.6 | 88 |
| 2018-19 | 0.14 | 44.8 | 83 |
| 2019-20 | 0.14 | 44.6 | 81 |
| 2020-21 | 0.189 | 60.4 | 61 |
| 2021-22 | 0.271 | 86.4 | 43 |
| 2022-23 | 0.309 | 98.6 | 33 |
| 2023-24 | 0.313 | 99.7 | 30 |
| 2024-25 | 0.314 | 100 | 28 |
| 2025-26 | 0.121 | 38.6 | 66 |
4.8 Decision Analysis
A weighted-criteria decision matrix evaluates three forward policy options on employment impact (weight 0.35), inclusion (0.25), fiscal cost (0.20) and implementation risk (0.20), each scored 1–5 from the empirical evidence above (Table 9). Digital-first processing reform hard SLA enforcement on the e-portal, automated scoring, straight-through margin-money claims scores highest (3.60) because it attacks the binding constraint (sanction capacity) at modest cost and risk. Credit-guarantee backed expansion scores 3.55: highest employment upside but heavier fiscal and implementation exposure; it is the preferred second phase once processing reform stabilises throughput. Status-quo delivery (3.40) is dominated. The recommended decision path is therefore sequential: reform processing first (FY 2026-27), then scale with guarantee-backed expansion (FY 2027-28 onward), reviewing against the Table 7 forecast bands.
Table 9. Weighted decision matrix of policy options
| Option | Empl. (0.35) | Incl. (0.25) | Cost (0.20) | Risk (0.20) | Weighted score |
| Status-quo delivery | 3 | 3 | 4 | 4 | 3.4 |
| Digital-first processing reform | 4 | 4 | 3 | 3 | 3.6 |
| Credit-guarantee backed expansion | 5 | 4 | 2 | 2 | 3.55 |
5. Findings
Demand is deep and stable: 43.5 lakh applications over ten years with a CV of only 11.8%, averaging 4.35 lakh per year regardless of macro conditions.
Supply is the constraint: sanctions (CV 47.7%) and credit (CV 55.4%) are four times more volatile than demand, and applications do not significantly predict sanctions (p = 0.186).
Efficiency tripled and then broke: sanction rate rose from 8.9% (2016-17) to a 31.4% plateau (2022-25), a statistically confirmed regime shift (p = 0.0001), before collapsing to 12.1% in FY 2025-26 a structural break coinciding with the terminal year of the 15th Finance Commission cycle.
Credit intensity is tight and rising: each sanctioned unit mobilises about Rs. 10.9 lakh of bank credit (R² = 0.943), with average project size rising from Rs. 7.2 lakh to Rs. 12.6 lakh.
Inclusion is improving on gender, stable on geography, skewed on social category: women’s share rose 1.22 points per year to about 40%; the rural share is statistically anchored at ~75%; SC (15.5%) and ST (7.6%) participation lags their guideline priority.
The sector mix has inverted: service-sector applications rose from 40.6% to 58.9% of the total (p = 0.0026), overtaking manufacturing from FY 2022-23.
The forecast is conditional on policy: restoring pre-break momentum implies 1.74–2.01 lakh sanctions and Rs. 19,000–22,000 crore of credit per year by FY 2028-29; persistence of the break halves those numbers.
Employment per crore of credit has fallen from 157 to 28 as projects deepen the scheme is trading breadth for depth.
6. Suggestions
Secure early continuation and front-loaded budgets: announce the 16th Finance Commission cycle continuation with Q1 margin-money releases so that the FY 2025-26 sanction collapse is not repeated at each cycle boundary.
Enforce processing SLAs digitally: hard-code the three-week IA forwarding limit and 30-day bank sanction clock into the PMEGP e-portal with automatic escalation to the DLMC and SLBCC dashboards.
Smooth the Udyam transition: provide assisted Udyam registration at DIC/KVIB counters and through the Backward and Forward Linkage fund so the 2023 mandatory-registration clause accelerates rather than delays margin-money adjustment.
Ring-fence the small-ticket segment: reserve a target share of sanctions for projects below Rs. 5 lakh to protect first-generation and artisan entrepreneurs as average ticket size rises.
Launch SC/ST outreach missions: use the sub-component plan monitoring, special awareness camps in poor-performing districts, and RSETI/RUDSETI-based EDP to lift SC/ST shares toward population parity.
Institutionalise women-entrepreneur pipelines: the 1.22-point annual trend can be accelerated with women-specific EDP cohorts, SHG-to-PMEGP graduation channels and priority bank scoring.
Adopt the sequential decision path: digital-first processing reform in FY 2026-27, followed by credit-guarantee backed expansion from FY 2027-28, monitored against the forecast bands in Table 7.
Publish district efficiency league tables: replicate the Table 8 benchmarking at district level through the PMEGP MIS so DLMCs manage to a visible frontier.
7. Conclusion
A decade of PMEGP data tells a story of a demand-rich, supply-constrained programme that engineered a genuine tripling of sanction efficiency between 2016-17 and 2024-25, mobilised Rs. 86,040 crore of institutional credit for nearly nine lakh micro-enterprises, held its rural character constant, and steadily feminised its beneficiary base. The eight-analysis framework converges on a single causal narrative: outcomes are governed by institutional processing and funding capacity, not by applicant demand. The FY 2025-26 structural break is therefore best read not as demand fatigue but as a policy-cycle artefact and equally, as a warning that the gains of the digital-portal era are reversible. If the suggestions above are implemented early cycle continuation, SLA-enforced digital processing, protected small-ticket and SC/ST segments, and sequenced expansion the forecast path of two lakh sanctions and 43% women participation by FY 2028-29 is attainable, keeping PMEGP central to India’s employment-generation and inclusive-entrepreneurship strategy.
References
[1] Ministry of Micro, Small and Medium Enterprises (2023). Revised Guidelines of Prime Minister’s Employment Generation Programme, O.M. No. PMEGP/UdhyamReg./01/2023 dated 07.12.2023. Government of India, New Delhi.
[2] Khanka, S. S. (2010). Entrepreneurship Development. S. Chand & Company, New Delhi.
[3] Kanithi, N., & Sardar, G. (2018). Performance of Prime Minister’s Employment Generation Programme in India: margin money utilisation and state-wise analysis. Journal of Rural Development, 37(2), 285–302.
[4] Mali, D. D. (2016). Khadi and Village Industries in rural employment generation: an appraisal of KVIC-implemented schemes. SEDME Journal, 43(1), 17–31.
[5] Datta, S., & Sahu, T. N. (2021). Impact of micro-credit on employment generation and empowerment of rural women. International Journal of Rural Management, 17(1), 140–157.
[6] Bhaskaran, E. (2023). Data envelopment analysis and regression-based efficiency studies of industrial clusters and government programmes in Tamil Nadu. Journal of the Institution of Engineers (India) (representative of the author’s cluster-efficiency research stream).
[7] NITI Aayog (2022). Aspirational Districts Programme: An Appraisal. Government of India, New Delhi.
[8] Reserve Bank of India (2022). Master Directions Priority Sector Lending: Targets and Classification. RBI, Mumbai.
[9] Khadi and Village Industries Commission (2024). PMEGP e-Portal Management Information System Reports. KVIC, Mumbai.
Disclaimer : The opinions expressed within this interview are the personal opinions of the interviewee. The facts and opinions appearing in the answers do not reflect the views of Indiastat or the interviewer. Indiastat does not hold any responsibility or liability for the same.
... Read more